Atmospheric reports
Atmospheric reports
Further information
REDAIR - Stations map
Date last updated: 14/09/2022
- Stations map
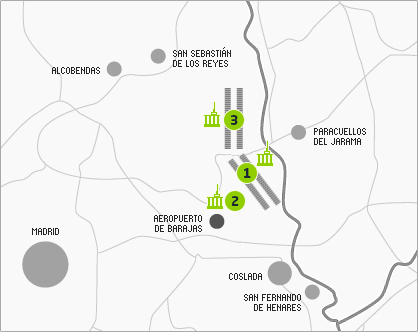
Key
 AIRPORT RUNWAY
 VERY GOOD LEVEL
 GOOD LEVEL
 ACCEPTABLE LEVEL
 HIGH LEVEL
 VERY HIGH LEVEL
| REDAIR1 | REDAIR2 | REDAIR3 | ||||||
|---|---|---|---|---|---|---|---|---|
| SO2µg/m3 | 0.32 | SO2µg/m3 | 2.12 | SO2µg/m3 | 2.64 | |||
| O3µg/m3 | 22.27 | O3µg/m3 | 11.75 | O3µg/m3 | 21.66 | |||
| COµg/m3 | 1.31 | COµg/m3 | 0.10 | COµg/m3 | 0.31 | |||
| NO2µg/m3 | 9.37 | NO2µg/m3 | 8.93 | NO2µg/m3 | 9.27 | |||
| PM2.5µg/m3 | 4.22 | PM2.5µg/m3 | 5.25 | PM2.5µg/m3 | 5.74 | |||
| HCTmg/m3 | 2.10 | HCTmg/m3 | 2.28 | HCTmg/m3 | 2.07 | |||
| PM10µg/m3 | 12.34 | PM10µg/m3 | 13.81 | PM10µg/m3 | 12.37 | |||
Note:
The Air Quality Index is a tool to inform the public, simply and quickly, about the quality of air we breathe, in accordance with the guidelines established by European and national regulations on air quality and the right of access to environmental information.
It is calculated from the values recorded in the network of air quality measurement stations, bearing in mind the limit values established by the legislation, mainly Royal Decrees 1073/2002 and 1796/2003, and the harmful effects of said contaminants for the health.
